Smart Agora Tutorial
Introduction
About this Tutorial
This user guide introduces you to the functionalities of Smart Agora and guides you on how you can easily create your own projects, experiments, and data collection. It guides you by listing the step-by-step procedure of crowdsourcing tasks in an automated way by the application, combined with extensive use of application screenshots, cross-references, and supplementary notes. All this is meant to give you a good understanding of the Smart Agora application and the crowd-sourcing dashboard in order to make use of it right away.
Smart Agora
Smart Agora provides a data-collection approach for data scientists by active participation in smart cities in which the experiment participants collect data by using simple yet ethically sensitive technology. Data scientists can autonomously initiate collective movements about data collection in an urban environment. These collective movements can be easily orchestrated by defining augmented points of interest in public urban space. The participants of an experiment can explore with their smartphones and in a gamified way these points while they anonymously share informed opinions and highly relevant contextual (sensors) data. Smart Agora platform consists of the following two core components:
Crowd-sourcing Dashboard
Smart Phone Application
Chapter 1 - Crowd-sourcing Dashboard
Data scientists and experiment participants both can create user-centric interactions such as questionnaires or surveys using the crowd-sourcing participation dashboard. The participation dashboard requests data and opinions from experiment participants in the public space of interest by crowd-sourcing tasks. These tasks are deployed at different points of interest in the public space, transforming them into augmented reality and making a highly interactive experience. The data scientist can log on to the crowd-sourcing dashboard to perform their respective tasks. (A System Diagram will be added later)
Logging on to Dashboard
On accessing the Crowd-sourcing dashboard by visiting the following link http://195.201.58.108:9000/, the Login window appears, as shown in Fig. 1. The purpose of this window is to secure the application from unauthorized access. You need to provide your authorized application Email ID and password in order to log on to the system successfully.
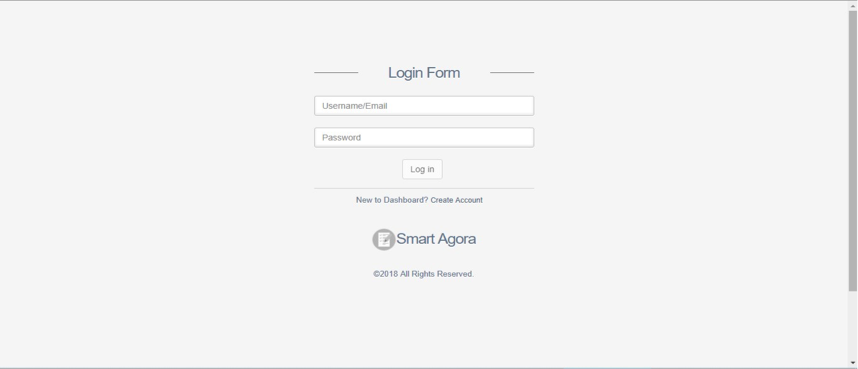
Fig. 1 Login Window
If you do not have credentials to access the system, click on “Create Account” and the following screen will appear for registration.
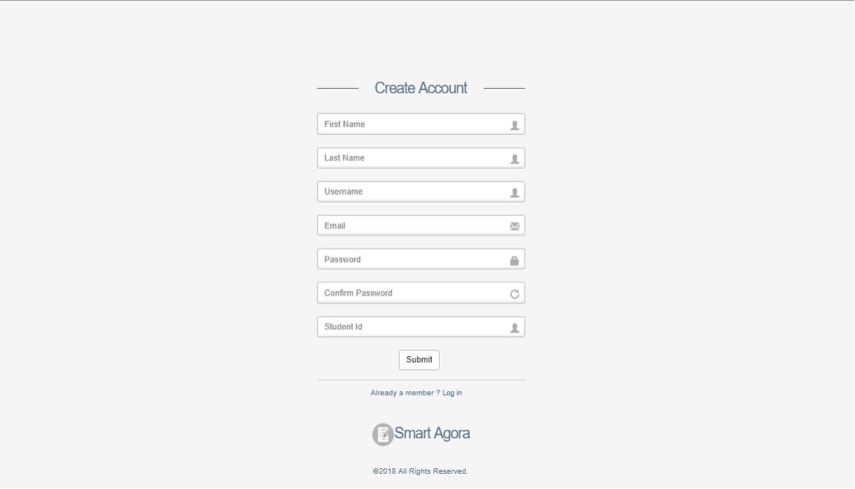
Fig. 2 Create an Account
Enter your first name in the First Name field.
Enter your last name in the Last Name field.
Enter your username in Username field.
Enter your email id in the Email field.
Enter your password in the Password field.
Enter your password again to Confirm Password.
Enter your Student ID in the Student ID field.
Click on Submit to proceed with account creation.
If you already have user credentials, please proceed with login.
Enter your Email ID or Username in the Email/Username field.
Enter your password in the Password field.
Click Log In.
Home Page
On successful login, the home page is displayed. This page appears as shown below

Fig. 3 Dashboard Home Screen
There is an option to update the profile or password by clicking the right menu (user icon) on the dashboard as shown in Fig. 4. It allows updating user’s information on the profile page (except the username and e-mail address that are considered unique for every registered user).
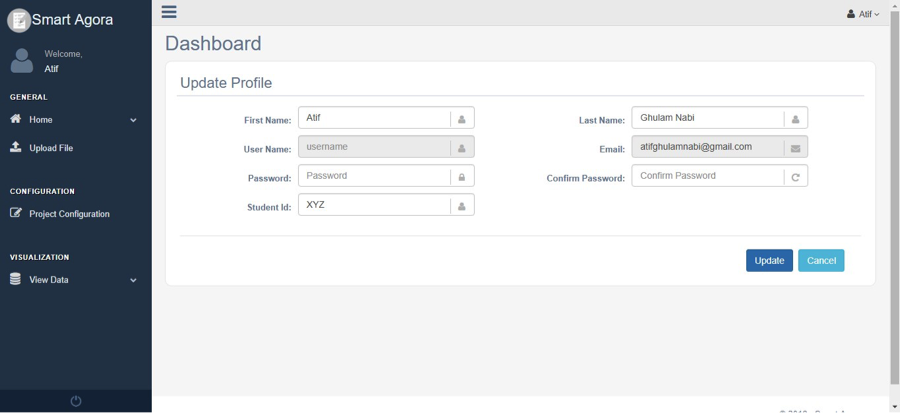
Fig. 4 Update Profile
From the dashboard’s home screen, you can proceed to crowd-source task(s). You can create projects, tasks, and assignments using the dashboard’s main menu. It’s important to note the following description of projects, tasks, and assignments before creating crowdsourcing tasks.
The following diagram shows the relationship between assets, assignments, and tasks.
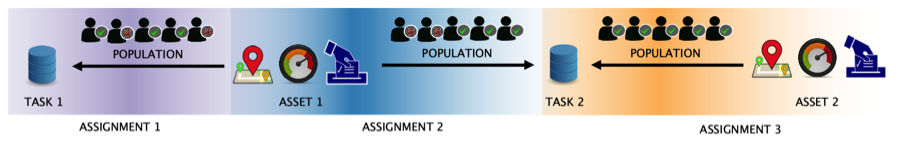
Fig. 5 Relationship Diagram
Please go to the Project Configuration from the left menu on the dashboard and create a new project as below.
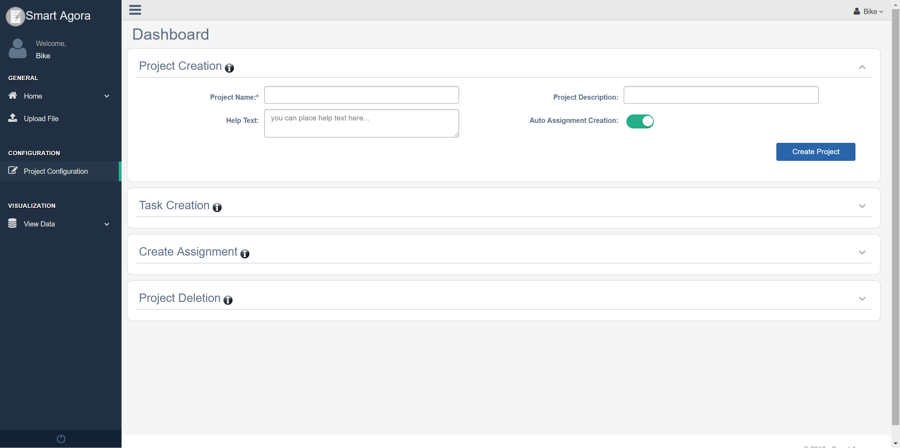
Fig. 6 Create a Project
Provide any regular string in the Project Name field.
It’s optional, additional information about the project in the Project Description field.
It’s optional, instructions about the assignment will be shown to experiment participants in Android App’s Help Text field.
By default, Smart Agora dashboard allows data scientist(s) to create assignments manually for experiment participants who are connected with the Project from Android App, it allows data scientist to control the list of participants who can join the project. Auto Assignment Creation switch button provides the functionality for experiment participants to join/perform an experiment without waiting for approval from the data scientist. The data, collected from experiment participants, will be saved in the first task.
Click on Create Project after providing the required information.
Next step is to create a task in the newly created project by clicking the Task Creation collapsible panel as shown below.
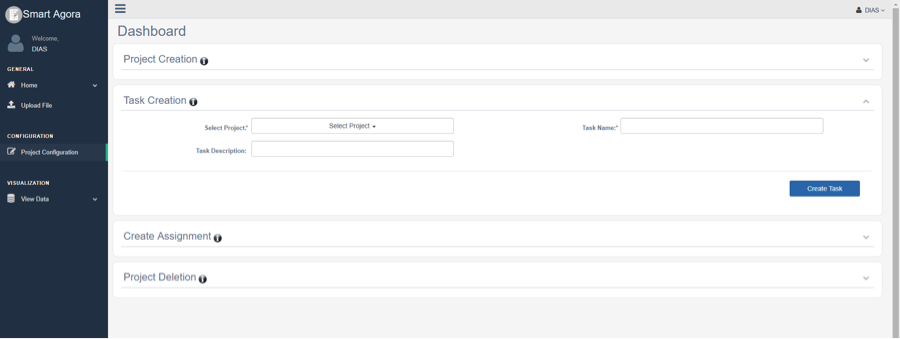
Fig. 7 Create a Task
Select a project from the Select Project dropdown list.
Provide any regular string title for the task in the Task Name field without any spaces.
Optional additional information about Task Description.
You can view details of the newly created project: View Data-> Projects as follows.
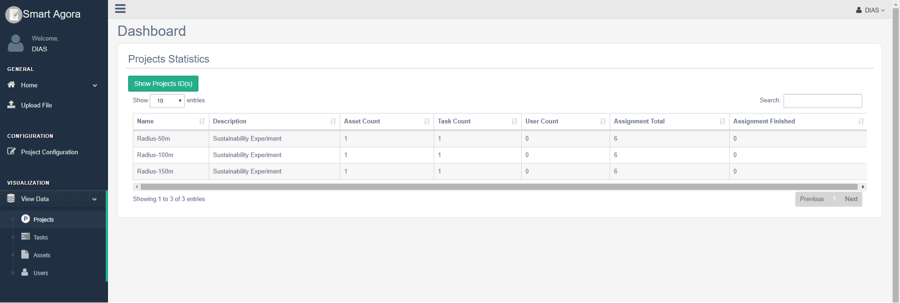
Fig. 8 View Project
Project Statistics:
Asset Count: shows the number of assets created for a project.
Task Count: shows the number of tasks created in a project.
User Count: shows the number of users connected with a project.
Assignment Finished: shows the number of completed assignments by the experiment participants.
You can view newly created task by selecting a project and task from View Data -> Tasks as shown below.
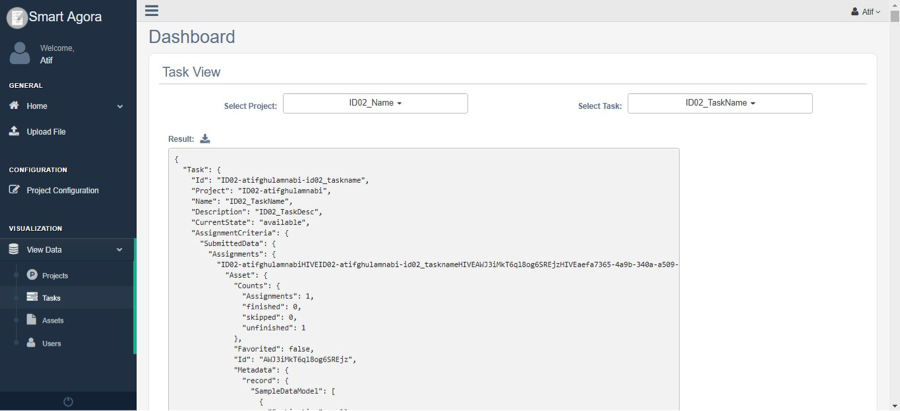
Fig. 9 View Tast
The data scientist can remove any project from the system manually by providing the ID of the project, the project ID can be viewed in the View Data-> Projects-> Show Project ID(s).
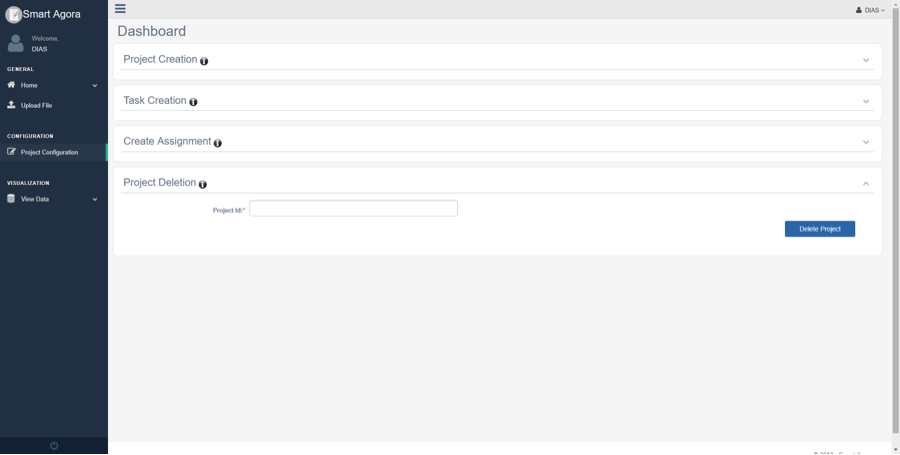
Fig. 10 Removing a project
Asset Creation
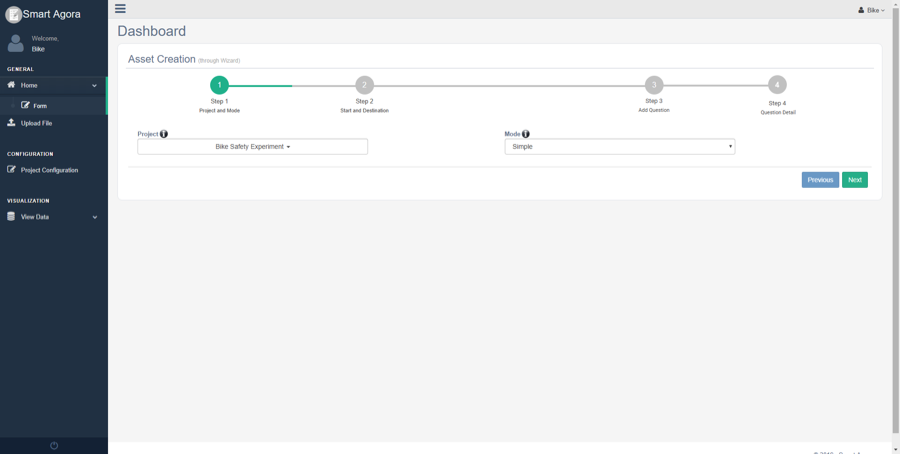
Fig. 11 Project and Mode
Sequence: You can create a data collection asset containing several survey questions. In sequence mode, these questions are created in ascending sequence order and experiment participants must have to follow the same sequence in order to answer all questions using the android app. For instance, if five questions are asked in a sequence, experiment participant will answer them in order (1st question, 2nd question, 3rd question and so on) before reaching the destination.
Simple: In this case, questions are created without any sequence. Experiment participants can randomly visit and answer survey questions using the android app by visiting checkpoints on the map while walking on a street or traveling through the city.
Decision: You can create a data collection asset with Decision mode for decision-based questions using crowd-sourcing dashboard. In this case, the next question will be asked to the experiment participant based on his answer to the previous question. For example, in a real-time scenario, if there is a question “Do you like Hbf?” for experiment participant and assume there two answers YES or NO, you may like to ask next question based on the previous answer e.g.” Take the train to airport.” or “Use bus to reach the airport”.
DIAS Simple: It allows to create multiple Likert scale questions (with the scale values (1-10)) at any location called “group point” and experiment participants can answer questions using the android app by randomly visiting group points on the map. Android app will compute the average, of Likert scale answer(s) at each group point, and send it to Dynamic Intelligent Aggregation Service (DIAS), which returns the aggregated response of all users at the same location. For example, an experiment participant provides information of noise level at any location by answering some Likert scale questions, android app will show the aggregated response of other users on the screen who have visited the same group point. It will also show the average value of the current experiment participant on-screen for instant real-time comparison.
Alternatively, you can also select start and destination locations by placing the cursor in the input field and click at the desired location on the map.

Fig. 12 Start and Destination (Decision or Sequence mode)
Note: There is an option to provide start and destination location in case of Sequence or Decision modes as shown in Fig. 13.
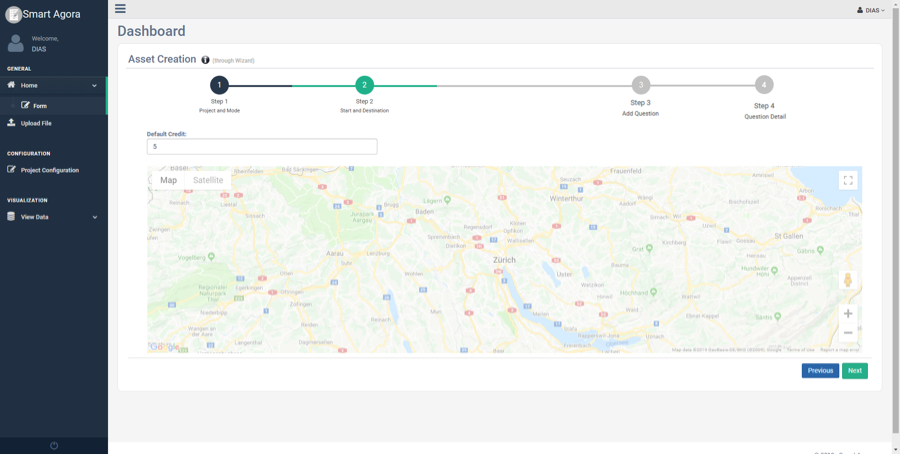
Fig. 13 Start and Destination (Simple or DIAS Simple mode)
Click the Next button after providing the required information, you will see the main screen for asset creation as shown in Fig. 14:
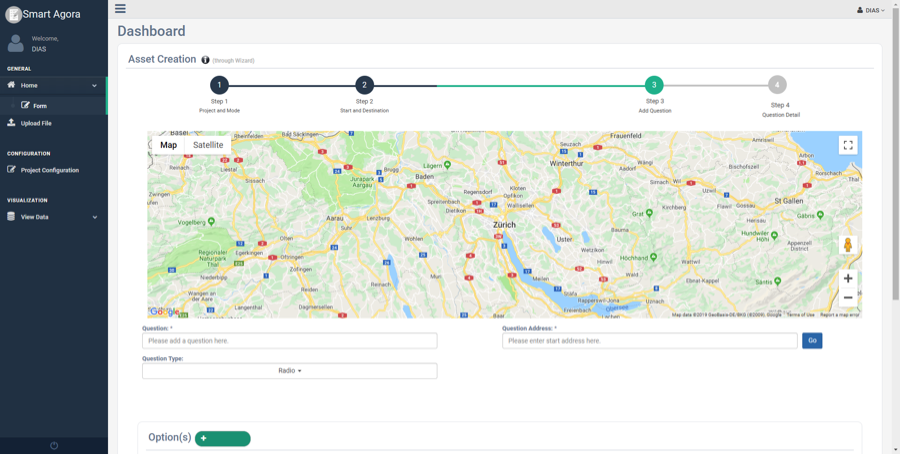
Fig. 14 Asset Creation
Asset Creation page consists of following sub-sections with collapsible panels.
Question(s)
Options
Advanced Options
Added Questions
Question(s): This section contains information to define questions for experiment participants. You can define questions at any location, and experiment participant will answer them by visiting checkpoints on the map using the android application.
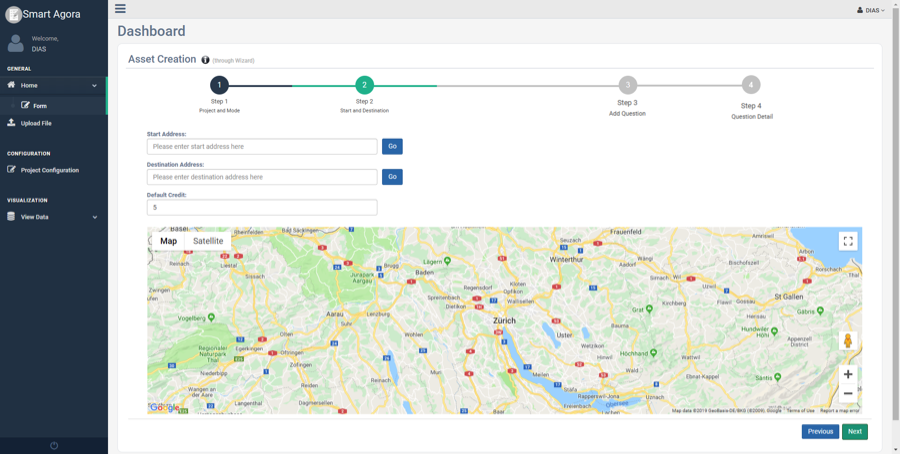
Fig. 15 Question (Sequence, Decision or Simple Mode)
Note: DIAS Simple mode supports only Likert Scale question type.
Option(s): You can add possible answers to every question along with a choice to define credit points for each option in case if selected question type is Radio or Checkbox.
Advanced Option(s): In advanced option(s) section you can set following advanced option(s) for while creating a question.
Time (s): time in seconds to record sensors’ information where the question will be asked on the map. By default, the value of time is 3 seconds.
Frequency: frequency can be set to high, low or medium to record sensors’ information. By default, the selected value of frequency is ’Medium’.
Sensors: You can select more than one sensor from the dropdown list to get the contextual information at the location of question. There are six types of sensors (Light, Gyroscope, Proximity, Accelerometer, Location, Noise) available to collect data from experiment participants at specific locations. By default, the selected value of the sensor is ‘Location’.
Vicinity: It is the range of the user to access checkpoints on the map (the distance from the user’s current position to the boundary of the ellipse while using the android app).
Click ‘Add Question’ button after providing the necessary details of the question, it will be added into the grid as shown in Fig. 21.
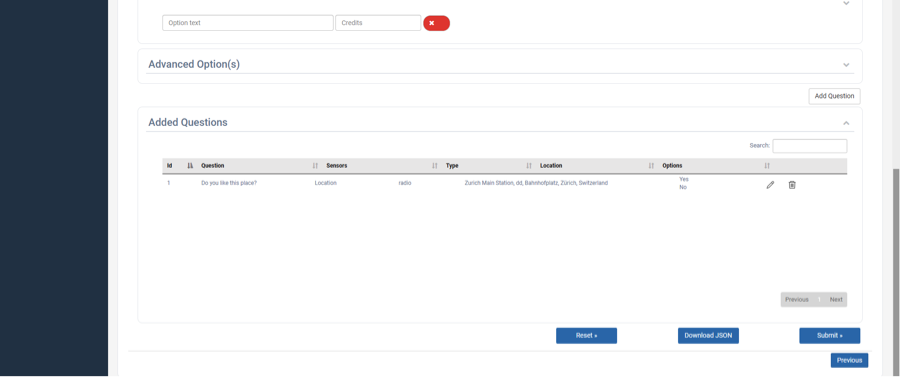
Fig. 16 Questions Grid
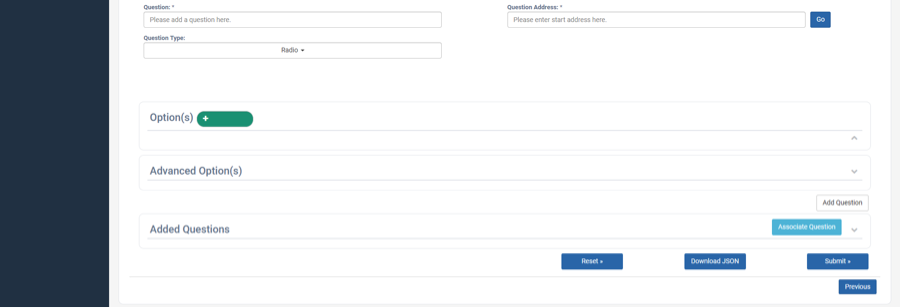
Fig. 17 Decision Mode Associate Question Button
It’s required to add at least two questions in the data collection asset for creating an association between questions. If you click on the Associate Question, a pop-up window will appear to create an association among the added questions as shown below:
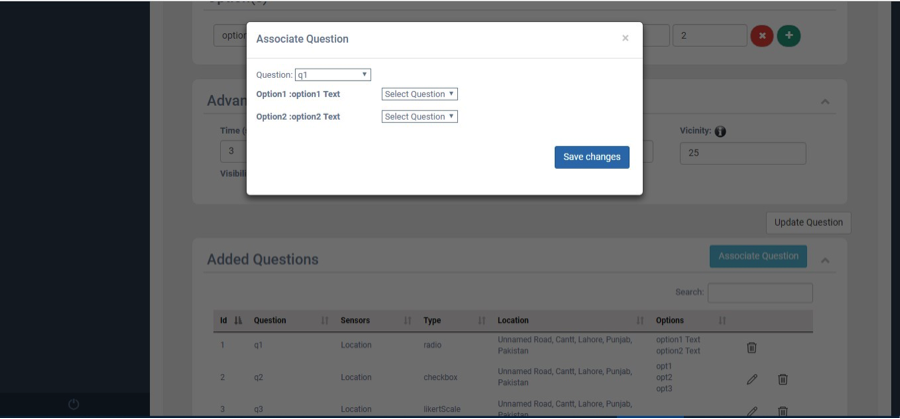
Fig. 18 Decision-Mode with Radio Button (Associate Question)
‘Question’ dropdown list will show all the questions that you have added in questions grid. You can select a question from the dropdown list to create an association with any other question. By selecting the question, it will show all possible answers i.e. options of question. You can configure the next question for every available option or combination in the selected question. Click the save button every time you associate a question on popup window as shown in Fig. 18. If you have associated all questions, click the close button and submit data collection asset to server.
If Decision Mode is selected and type of question is Checkbox, there might be more than one options to answer a question e.g.
- What caused you difficulty at these buildings?
Parking problems
Reception area
Difficulty with transport
which means participants can select more than one options, so the next question can be asked based on one or the combination of more than one checkbox options. If you define more than one options for checkbox question, all possible combinations will be generated on the screen as shown in Fig. 19. It’s allowed to create only seven options for a question if the type of question is a checkbox.
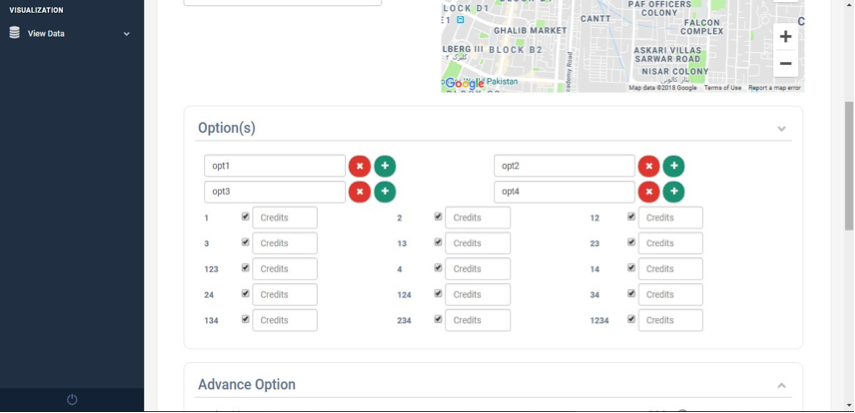
Fig. 19 Decision Mode checkbox combinations
You can simply associate question for each possible combination, as shown in Fig. 20. Similarly, save all associations and close the popup window.
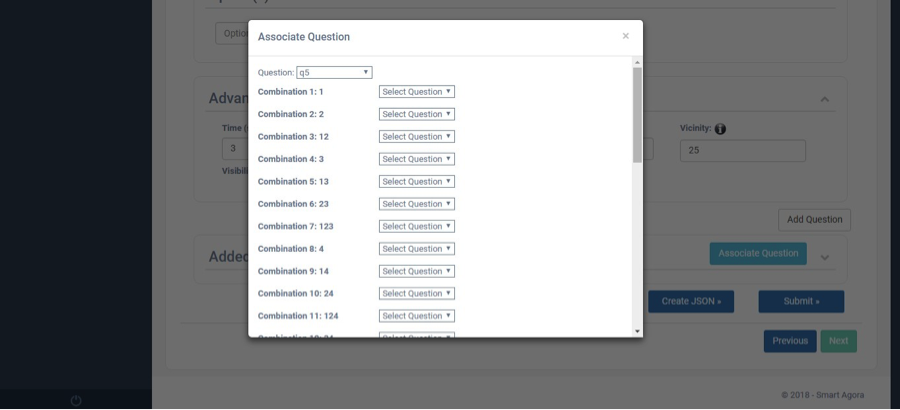
Fig. 20 Decision-Mode with Checkbox(Associate Question)
Please click on the Add Question after providing the required information. Question will be added in the data grid, allowing users to update or delete it from the grid as shown in Fig. 21.
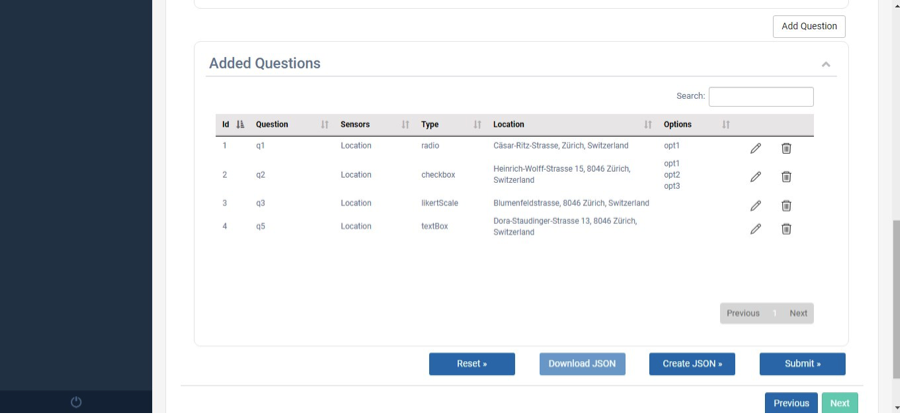
Fig. 21 Question Grid
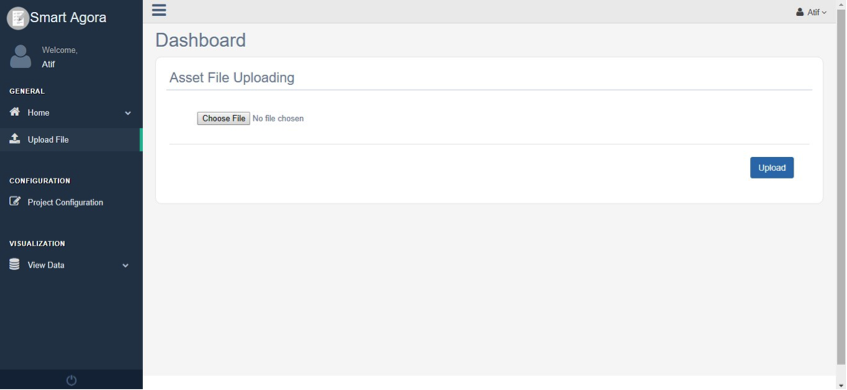
Fig. 22 Upload Data Collection Asset Manually
Chapter 2 - Smart Agora Android application
Smart Agora Android Application fosters for data scientists a more informed data collection approach at relevant public spaces. By encouraging physical presence in an augmented and gamified way, experiment participants visit public spaces more evidently and can collect highly relevant data about their environment. The experiment participant moves in the urban environment via different transport means or on foot. Physical presence provides to experiment, participants, the opportunity to witness points of interest in which data collection is required. The physical space turns to an augmented and gamified landscape for data collection.
Specifications for app installation:
Please open the Settings on your android device.
Tap “Security”. it will open the Security menu.
Scroll down and check the “Unknown sources” box. Tap “OK” to confirm that you want to enable this.
Download Smart Agora APK directly to your device from a shared location. Navigate to the location of the downloaded APK file installation.
Tap the APK. This will immediately open the installer for the app. You can review the permissions before the app is installed, you will see a list of the services that it will have access to.
Tap “Install” to install the app. The app will automatically install, and an icon for it will be added to your Home screen. You can tap the “Open” button in the installer to open it immediately.
Smart Agora
Start the application by clicking the app icon on your android device. A splash screen will appear for a few seconds meanwhile application loads its resources.
Fig. 23 Smart Agora - Splash Screen
The application will ask the user to turn the GPS on if it is disabled on the android device as shown in Figure 25. It will show the current location of the user after activating the GPS.
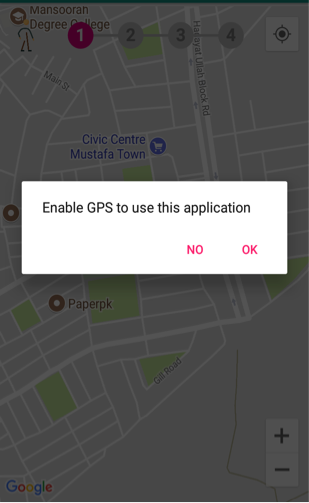
Fig. 24 Smart Agora - Enable GPS
You will land on the home screen after turning on the GPS location. Home screen consists of the following functionalities:
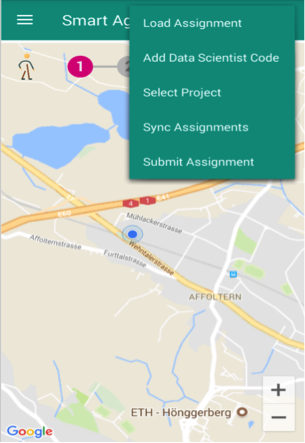
Fig. 25 Smart Agora - Right Menu
There is a right menu option in smart agora app, available on the right side of header, mainly to select projects and get new assignments as shown Fig. 25.
Experiment participant can select a project by providing data scientist code, sync assignments (to get new assignments), load an assignment to perform an experiment and mark an assignment as ‘complete’ by clicking on Submit Assignment from right menu option. If an experiment participant has already completed an assignment or submitted it manually from right menu, it will not be shown after sync. assignments.
If a data scientist is registered at the crowed-sourcing dashboard with an email e.g. datascientist@gmail.com, the user name (i.e. datascientist) will be considered as code of data scientist to access their projects.
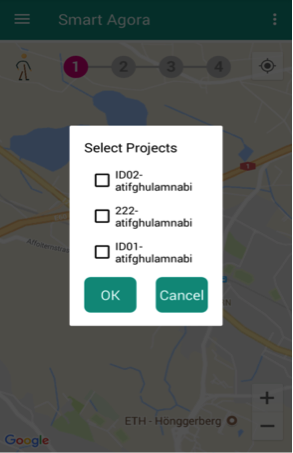
Fig. 26 Available Projects
If an experiment participant is connected with a project, data scientists can visit the crowd-sourcing dashboard and create an assignment for the experiment participant from dashboard following Projects Configuration -> Create Assignment as shown in Fig. 27.
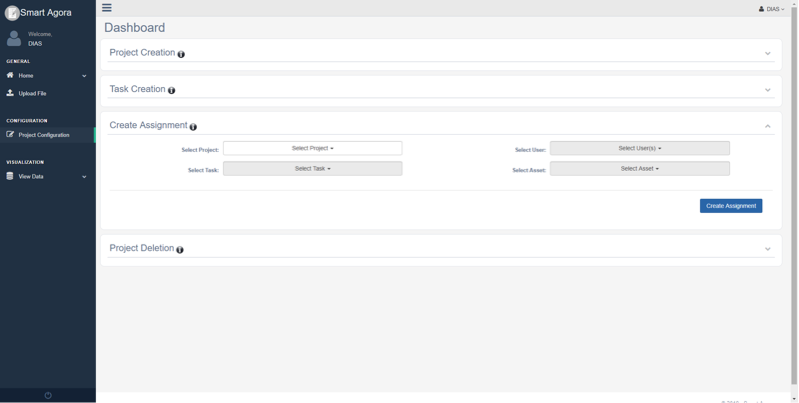
Fig. 27 Dashboard - Create Assignment
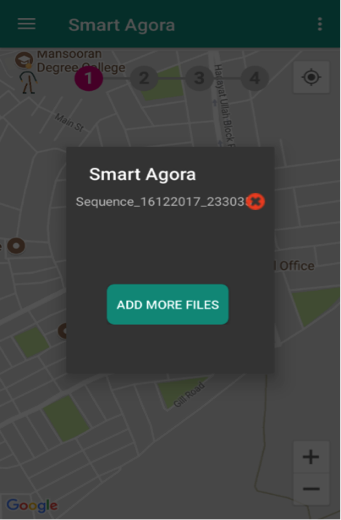
Fig. 28 Available Assignments
Tap on the assignment (e.g. Sequence_16122017_23303) to load into the map as show in Fig. 28. In addition, there is a cross icon with every file to delete it from application. If data participant has deleted an assignment by mistake, it can be reloaded from server by clicking Sync. Assignment from right menu options of smart agora. If an assignment has already been marked as completed, it cannot be opened or submitted again.
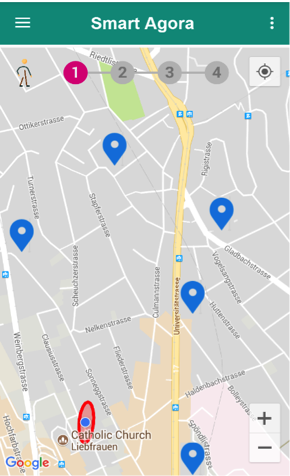
Fig. 29 Assignment loaded on the map
Experiment participant’s current position will be shown with an ellipse around his current location after loading the assignment as show in Fig. 29.
Car: 1 second
Train: 0.5 second
Walk: 7 seconds
Bicycle: 6 seconds
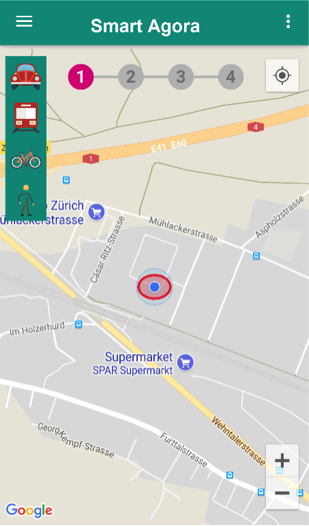
Fig. 30 Smart Agora - Transport Means
There is a transport menu available on left side in application to change transport means by selecting an icon for walking, car, bus or tram once the assignment has been loaded in the application. By default, the selected transport mean is walking as shown in Fig. 30.
If an experiment participant does not follow the route on the map and is not within the specified tolerance, then a message “Please follow the route.” will be shown to the user. The tolerance is set to 50 meters and application will add GPS accuracy value in this tolerance. This rule (i.e. “Please follow the route”) isn’t applicable for Simple and DIAS Simple mode, because the questions are distributed on the map at different locations without start & destination locations and the participant don’t need to follow a route] By default, the tolerance is set to 50m.
You can also see a state progress bar on the home screen, it shows the progress while completing an assignment. If an assignment is completed successfully, all states of the progress bar are marked.
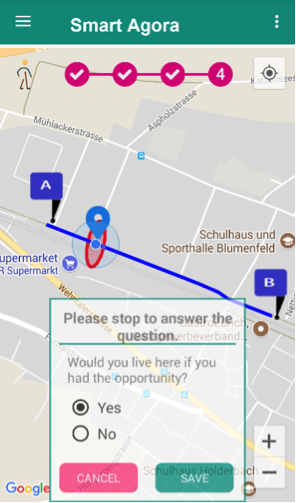
Fig. 31 Smart Agora - Question pop up
If a question comes into the vicinity of a user, a pop up will appear to ask a survey question to the user as shown in Fig. 31.
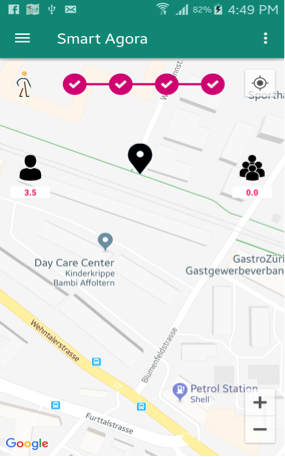
Fig. 32 DIAS Simple Mode
In DIAS Simple mode you can see your average response and aggregated response of other participants at the same location as shown in Fig. 32.
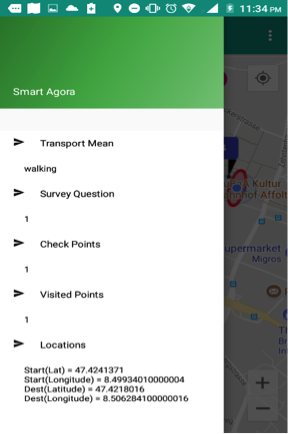
Fig. 33 Smart Agora - Left Menu
Transport Mean: It shows a selected transport mean from home screen.
Survey Questions: It shows total number of questions to be asked in case of simple and sequence mode.
Location: It shows coordinates of starting and destination location.
Check Points: It shows total number of checkpoints on the map.
Visited Points: It shows the number of visited checkpoints.
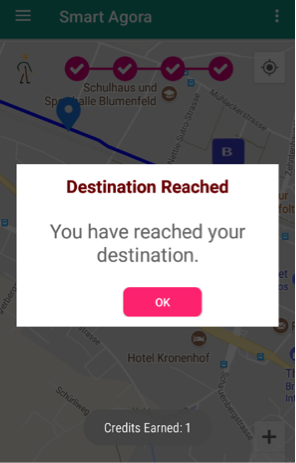
Fig. 34 Smart Agora - Destination Reached
When the user is reached at destination, a pop-up will appear “Destination Reached” as shown below. Application asks the user to click OK button and the completed assignment is submitted to the server and user returns to home screen after clicking OK. Similarly, multiple assignments can be completed repeating the same steps.
If an experiment participant has completed an assignment by visiting all questions on the map, it will be submitted to the server. Data scientists can visit the dashboard again to see an increment into Assignment Finished counter from Projects Configuration-> All Projects.
Data scientists can access data of all completed assignments and sensors’ data in JSON format from the dashboard in order to perform analysis on the data. View Data -> Tasks. It also allows downloading JSON file from Result icon as shown below.
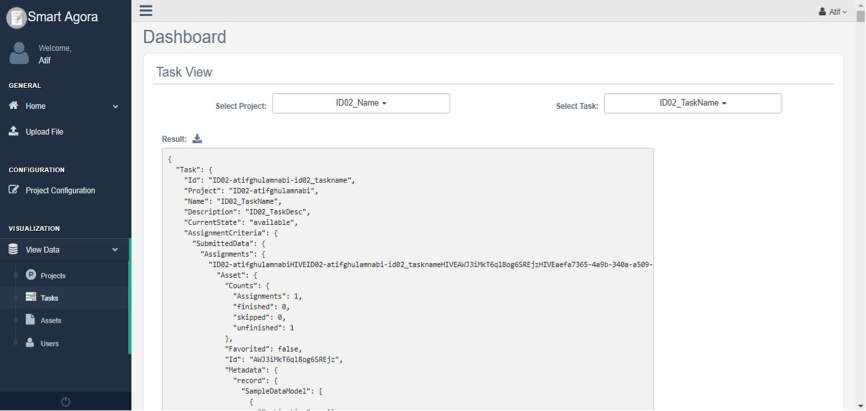
Fig. 35 View Task
There is an additional option to access data files (i.e. completed assignments & sensors’ data) from the device’s internal storage (Mydevice/Android/data/smartagora.ethz.ch/files/Assignments) in case of any problem in network connection to the server.